28. Opsview Core
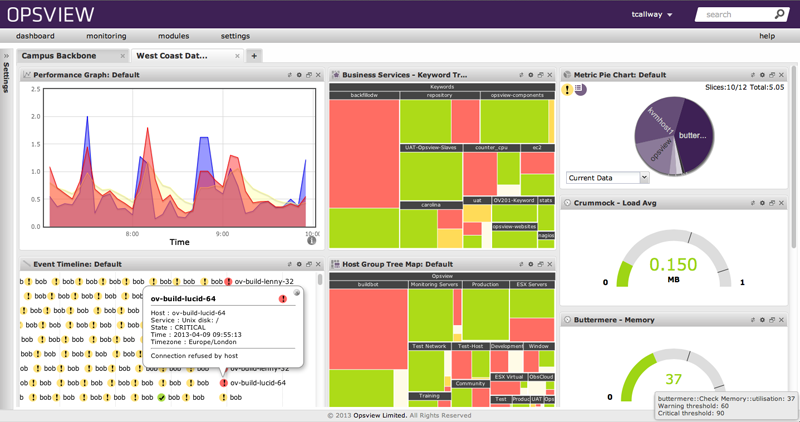
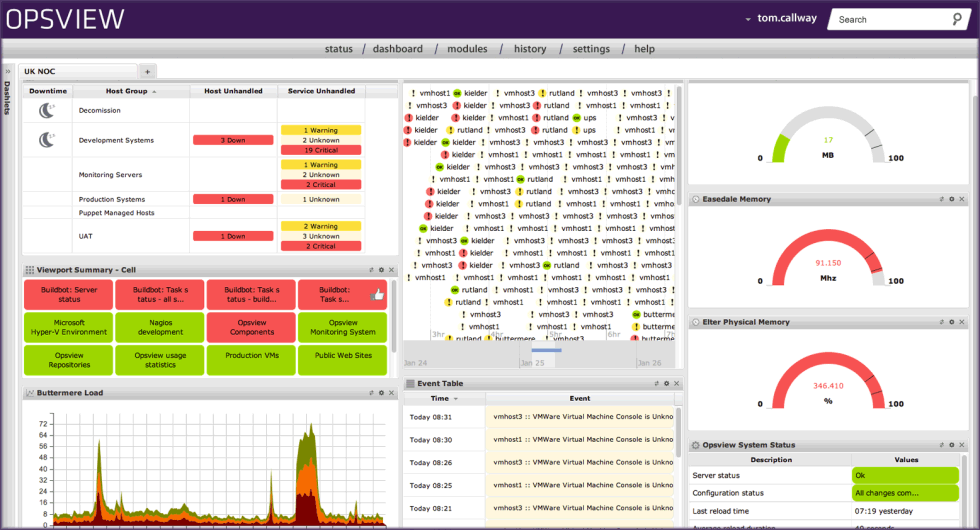
Opsview is an open-source monitoring solution written in PERL and based on Nagios Core. It uses MySQL to store its data, provides SNMP support and uses RRDTool for graph plotting.
29. Orca
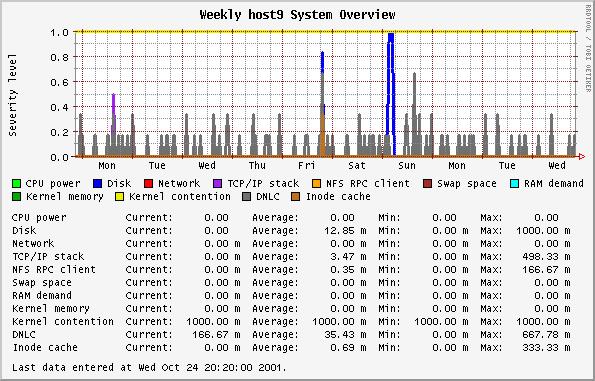
Orca is a tool useful for plotting arbitrary data from text files onto a directory on Web server. Orca is similar to but substantially different from other tools that record and display hourly, daily, monthly, and yearly data, such as MRTG and Cricket.
30. Pandora FMS
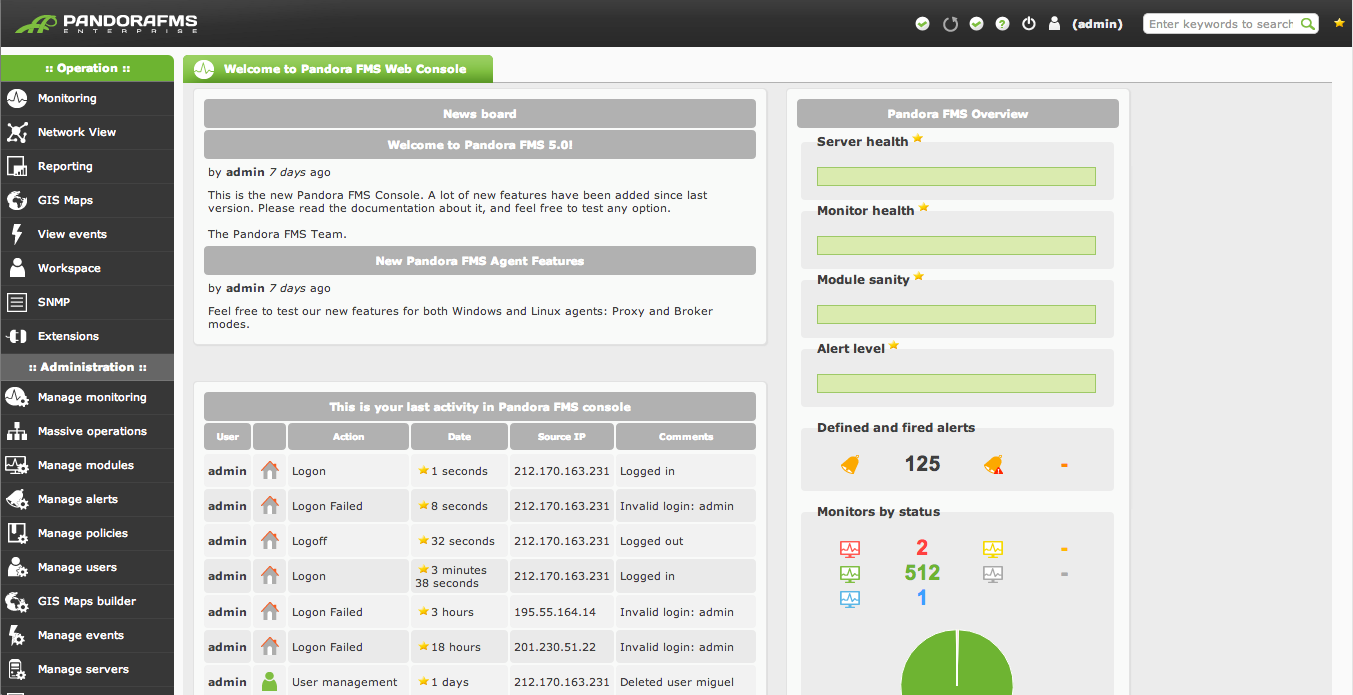
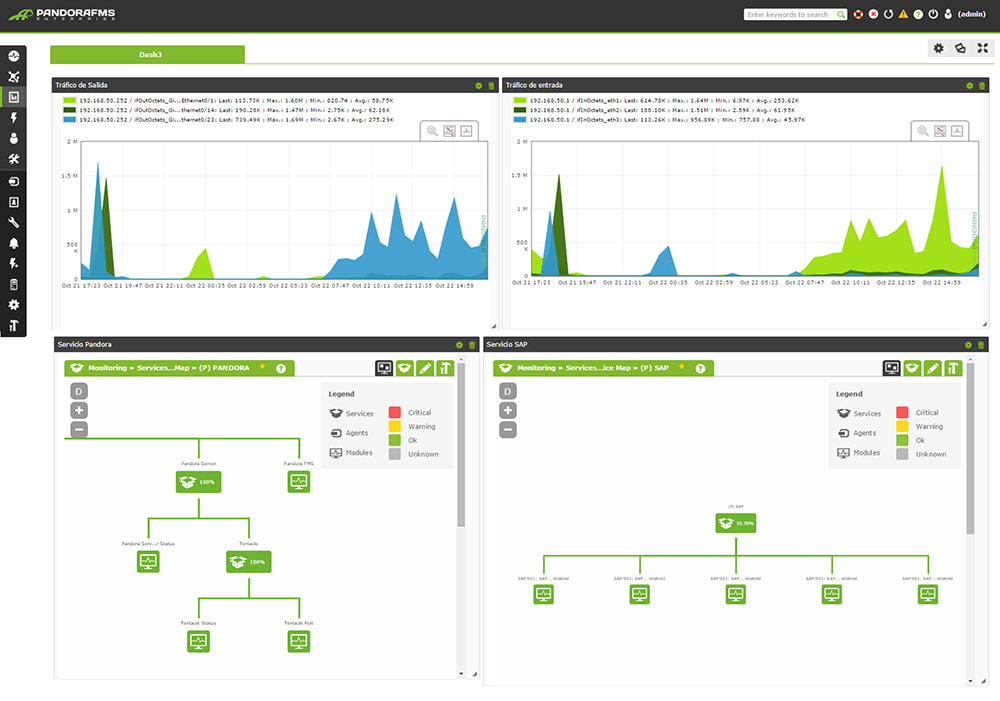
Pandora FMS (for Pandora Flexible Monitoring System) is software for monitoring computer networks. Pandora FMS allows monitoring in a visual way the status and performance of several parameters from different operating systems, servers, applications and hardware systems such as firewalls, proxies, databases, web servers or routers.
Samples of network monitoring checks:
- ICMP response and delay
- SNMP Polling (v1, v2c, v3)
- Standard TCP/IP services (HTTP, SMTP, etc)
- Specified TCP/IP ports with regular expression matching
- URL availability
- CPU, Disk and Memory Usage
- System overload
- Nagios Plug-in Support (for both, availability and performance)
Samples of agent based monitoring:
- Linux/Unix process availability (via SNMP)
- Network traffic in a device
- Network latency time
- Obtention of WMI or Performance
- Counters values in Windows
- Number of occurrences in a logfile per second
- Temperature on a system
- Output of a system command
- Service availability or running processes
- Oracle DB status, as well as its tablespaces and other values
SLA and reporting
Pandora FMS can create HTML, PDF and XML reports for any monitored element. Data, such as graphs, SLAs, metrics, events, etc., can be added to these reports.
Remote server management
Using the integration with eHorus it’s possible to control devices remotely. This can be done either through a remote desktop or via the command line (Linux, Mac and Windows).
Fault and event management
The Pandora FMS event system keeps a log of everything that has happened. When a service or a host goes down – or comes up again – , when an alert is fired, when new hosts in the network are discovered, etc.
It’s possible to search for single events, filtering them out by group, type, severity, or event status. Events can be exported to a CSV file, or be linked to feed readers.
High availability
Pandora FMS has a multi-server based structure (Data Server, Plugin Server, Network Server, etc), a Web console, and a Database. It has redundancy over all its systems. Any amount of servers or consoles can be created, as well as MySQL clusters for the Database.
GIS Geo-location
Pandora FMS can provide different information on locations, and interactive maps that show the real time position of agents. It can also generate movement tracking for each agent throughout time using reverse geo-localization and “translating” the coordinates into standard addresses.
31. PolyMon
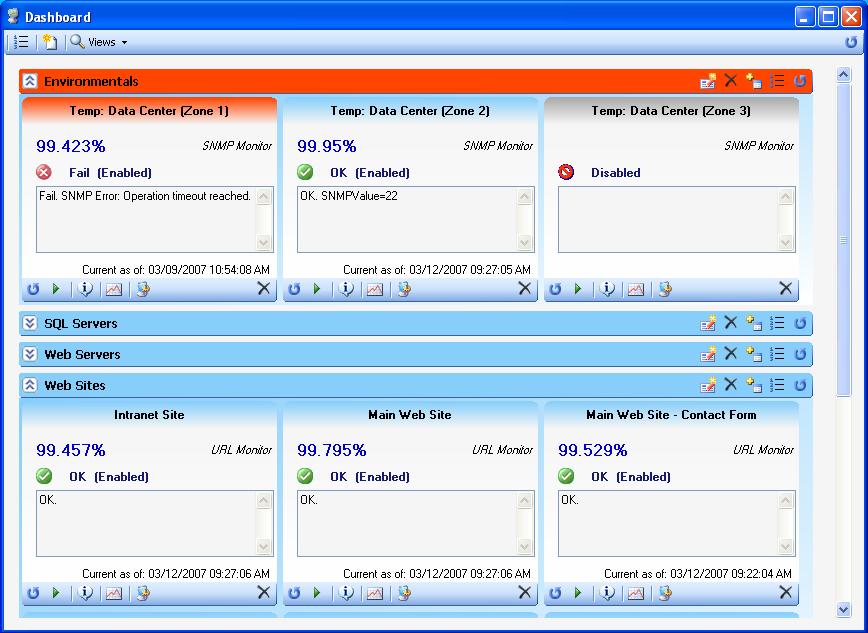
PolyMon is an open source system monitoring solution that can be used to generate email alerts and analyze historical trends of monitor counters and monitor statuses. It is based on the .NET 2.0 framework and SQL Server 2005.
PolyMon is made up of three primary components:
- A SQL Server database to store monitor statuses, alerts and general settings.
- A windows service (PolyMon Executive) that runs monitors on a periodic basis, logs results to the database and sends out email notifications.
- A management/monitoring front-end (PolyMon Manager) that is used to manage general settings, monitor definitions, operators, alert rules, etc. and analyze historical trends (both monitor counters and statuses).
Current PolyMon plug-ins include: CPU Monitor, Disk Monitor, File (Age and Counts), Windows Performance Counters Monitor (built-in Performance Counter browser), Ping, PowerShell Scripting, SQL Monitor (Can run any stored procedure that returns resultsets in a specific format), SNMP Monitor, TCP Port Monitor, URL (HTML) Monitor, URL (XML) Monitor, Windows Service Monitor, WMI Monitor (built-in WMI browser and query builder)
32. PRTG
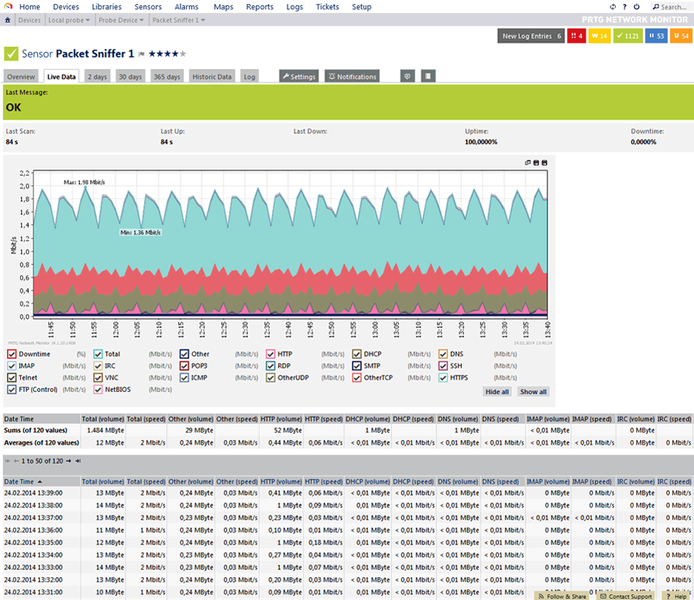
PRTG runs on Windows and monitors network availability and network usage using SNMP, Packet Sniffing, WMI, IP SLAs and Netflow and various other protocols. More than 150,000 users use the freeware and commercial editions. Since the release of PRTG 9, the software supports the monitoring of IPv6 devices.


